No country gets close to a perfect score in the Corruption Perceptions Index 2016.
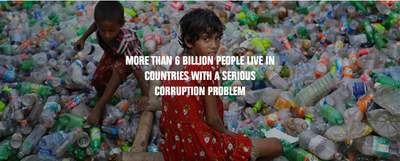
Over two-thirds of the 176 countries and territories in this year’s index fall below the midpoint of our scale of 0 (highly corrupt) to 100 (very clean). The global average score is a paltry 43, indicating endemic corruption in a country’s public sector. Top-scoring countries (yellow in the map below) are far outnumbered by orange and red countries where citizens face the tangible impact of corruption on a daily basis.
This year’s results highlight the connection between corruption and inequality, which feed off each other to create a vicious circle between corruption, unequal distribution of power in society, and unequal distribution of wealth.
In too many countries, people are deprived of their most basic needs and go to bed hungry every night because of corruption, while the powerful and corrupt enjoy lavish lifestyles with impunity.”
– José Ugaz, Chair of Transparency International
The interplay of corruption and inequality also feeds populism. When traditional politicians fail to tackle corruption, people grow cynical. Increasingly, people are turning to populist leaders who promise to break the cycle of corruption and privilege. Yet this is likely to exacerbate – rather than resolve – the tensions that fed the populist surge in the first place. (Read more about the linkages between corruption, inequality and populism.)
Corruption perceptions index 2016
http://www.transparency.org/news/feature/corruption_perceptions_index_2016
